1

Corruption Perception Index (CPI) 2023

India’s rank in the Corruption Perception Index (CPI) 2023 has slipped to 93 out of 180 countries, with a score of 39.

About Corruption Perception Index (CPI):

  • It is an annual index released by Transparency International, a global civil society organisation.
  • Since its inception in 1995, the Corruption Perceptions Index has become the leading global indicator of public sector corruption.
  • The CPI ranks 180 countries and territories by their perceived levels of public sector corruption on a scale of zero (highly corrupt) to 100 (very clean).
  • It uses data from 13 external sources, including the World Bank, World Economic Forum, private risk and consulting companies, think tanks and others.
  • The scores reflect the views of experts and business people, not the public.
  • Highlights of CPI 2023:
  • CPI-2023 results show that most countries have made little to no progress in tackling public sector corruption.
  • CPI global average score remains unchanged at 43 for the twelfth year in a row.
  • Denmark topped the index for the sixth consecutive year.
  • Somalia was ranked last, other countries occupying the bottom spots included: Venezuela, Syria, South Sudan and Yemen.
  • India has tied with Maldives, Kazakhstan, and Lesotho to rank at 93 out of 180 countries. In 2022, India was ranked at 85.
  • Pakistan scored 29 with a rank of 133 and China, scored 42 occupying rank 76.


AISHE 2021-22

All India Survey of Higher Education (AISHE) 2021–22 was made public on January 25, 2024.

  • Initiated in – 2011.
  • Aim – To give complete picture of Higher Education in the country.
  • 3 Categories – Universities, Colleges and Stand-alone institutions.
  • Data source – Voluntary uploading of data by institutions of Higher Education listed in www.aishe.gov.in portal.
  • AISHE 2021-22 – It was the 11th Survey and 1st Survey conducted through Web Data Capture Format (DCF).

For the 1st time, all the major Stakeholders in Higher Education, such as UGC, AICTE, MCI as well as State Governments participated in the data collection exercise for AISHE 2021-22.

Key takeaways from AISHE 2021-22 Report

  • Increase in enrolment – 4.33 crore students, up from 2020-21 level, captured in 8 different levels.

Aishe2021

  • Primacy of government institutions – 73.7% of all students attend government universities, where state public universities have the largest share of enrolment, accounting for around 31%.
  • Higher enrolment of females – It has steadily increased to 2.07 crores in 2021-22, a 32% jump from 2014-15 levels with the highest numbers at the post graduate level, 55.4% are women.
  • Gender Enrolment Ratio – It is 28.4 for the age group 18-23 years at all India level (population data from the 2011 census) and is in favour of women in 26 states and Union Territories.
    • Chandigarh boasts of the highest GER (64.8%), followed by Puducherry, Delhi and Tamil Nadu.

Gross Enrolment Ratio (GER) indicates how many students are part of the higher education system in a given population.

  • Gender Parity Index – It is 1.01 at all-India level, and for SC and ST categories, it is 1.01 and 0.98 respectively.

Gender Parity Index (GPI) shows the ratio of the female GER to male GER. A GPI of 1 indicates parity between the two genders, GPI greater than 1 indicates a disparity in favour of females.

  • Higher preferences for Arts – In UG, Bachelor of Arts (BA) and in PG, Master of Arts (MA) programme has the highest enrolment.
  • Demographics of students graduating – Among the graduated students, roughly 50.8% are women and the graduation rate in arts and social sciences streams is higher than others.
  • Category-wise, around 35% of the students belong to OBC, 13% are from SC and 5.7% are from ST community.


Global Liveability Index 2023

Recently, the Economist Intelligence Unit (EIU) unveiled its highly anticipated Global Liveability Index 2023.

About Global Liveability Index 2023:

  • The index quantifies the challenges presented to an individual’s lifestyle in 173 cities worldwide. 
  • It was given considering five metrics: healthcare, culture, environment, education, and stability.
  • This ranking offers insights into the cities that excel in providing an exceptional quality of life.

Key highlights of the report

  • Top cities to live: Vienna (Austria), Copenhagen (Denmark), Melbourne and Sydney (Australia)
  • Bottom 3 Liveable cities: Algiers (Algeria), Tripoli (Libya) and Damascus (Syria)
  • From Asia, Japan’s Osaka was ranked number 10 in the rankings.
  • The index rose last year to reach a 15-year high as the world recovered from the pandemic.
  • The average index score is now 76.2 out of 100, up from 73.2 a year ago. 
  • Despite overall growth in the index score, stability saw a marginal decline.
  • Those in Western Europe, in particular, have slipped in rankings due to increased instances of workers’ strikes failing to “match gains” made by cities in Asia and the Middle East.
  • The cities which are plagued by ongoing civil unrest and military conflicts, amongst other issues, remained at the bottom of the list


National Time Release Study (NTRS) 2023 report

Central Board of Indirect Taxes and Customs (CBIC) releases National Time Release Study (NTRS) 2023 report

Key details:

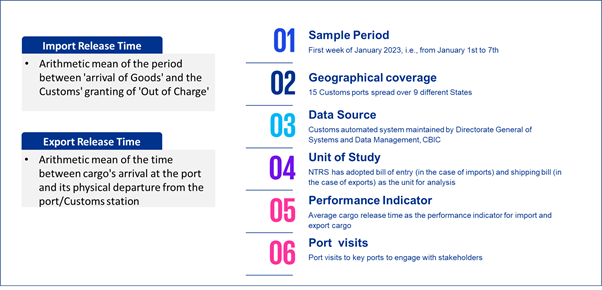
  • Time Release Study (TRS) is a performance measurement tool.
  • It aims to present quantitative measure of the cargo release time.
    • Cargo release time is defined as the time taken from arrival of the cargo at the Customs station to its out of charge for domestic clearance in case of imports and arrival of the cargo at the Customs station to the eventual departure of the carrier in case of exports.
  • NTRS 2023 presents port-category wise average release time for the current year:
    • assess the progress made towards the National Trade Facilitation Action Plan targets;
    • identify the impact of various trade facilitative initiatives, notably “Path to Promptness”; and
    • identify the challenges to more expeditious reduction in release time.
  • NTRS 2023 recognises the distinction between:
    • regulatory clearance (also referred as customs release), which gets completed with the grant of Let Export Order (LEO) and
    • physical clearance which occurs on completion of logistics processes with departure of the carrier with the goods.

https://static.pib.gov.in/WriteReadData/userfiles/image/image002IS4B.png


Centralized Public Grievance Redressal and Monitoring System

13th Report on Central Ministries/Departments performance on CPGRAMS released by DARPG.

Key Details:

  • The Department of Administrative Reforms and Public Grievances (DARPG) released the Centralized Public Grievance Redressal and Monitoring System (CPGRAMS) monthly report.
  • It provides a detailed analysis of types and categories of public grievances and the nature of disposal.
  • This is the 13th report on Central Ministries published by DARPG.

About CPGRAMS:

  • Centralized Public Grievance Redress and Monitoring System (CPGRAMS) is an online platform available to the citizens 24×7 tlodge their grievances to the public authorities on any subject related to service delivery.
  • It is a single portal connected to all the Ministries/Departments of Government of India and States.
  • Every Ministry and States have role-based access to this system.
  • CPGRAMS is also accessible to the citizens through standalone mobile application downloadable through Google Play store and mobile application integrated with UMANG.
  • CPGRAMS also provides appeal facility to the citizens if they are not satisfied with the resolution by the Grievance Officer.

Public Grievances

  • The Allocation of Business Rules, 1961, allocates to DARPG inter alia, the responsibility for Policy, Coordination and Monitoring of issues relating to:
    • Redress of Public Grievances in general and
    • Grievances pertaining to Central Government Agencies.
  • The Public Grievance Division is responsible for this activity since 1987.
  • From 1997, the Division has also been made responsible for Citizen Centric Initiatives, namely, Citizens Charter.


Gender Social Norms Index

Gender Social Norms Index released recently.

Key findings of the report:

  • Released by:
    • The United Nations Development Programme (UNDP)
  • The past decade didn’t see any improvement in the level of prejudice shown against women.
  • Nearly 90% of people still hold at least one bias against women.
  • UNDP tracked people’s attitudes towards women in four dimensions:
    • political,
    • educational,
    • economic and
    • physical integrity.
  • The latest GSNI report capturing data up to 2022 showed little overall progress, despite global and local campaigns for women’s rights in recent years such as Me Too, Ni Una MenosTime’s Up and Un Violador en Tu Camino.
  • Repercussions of such bias:
    • Persistent biased gender social norms violate human rights and limit the enlargement of well-being by impeding women from acting on behalf of their own values and interests.
    • By excluding women from decision-making, the world will lose out on perspectives, experiences, abilities, voices and ideas.
    • Biased gender social norms can contribute to lack of equality in political participation.
    • In some cases, biases might even intensify in the form of backlash when women attain leadership positions.
  • Political bias:
    • Countries with greater bias in gender social norms also show a lower presence of women in parliament
    • Indigenous womenmigrant women and women with disabilities have meagre political representation, demonstrating how overlapping biases can further reduce opportunities for women.
    • On average, the share of heads of state or government who are women has remained around 10 per cent worldwide since 1995, and women hold just over a quarter of parliament seats globally.
    • Women are grossly underrepresented in leadership in conflict-affected countries, mainly at the negotiation tables in the recent conflicts in Ukraine (0 per cent), Yemen (4 per cent) and Afghanistan (10 per cent).
    • Globally, about seven of 10 peace processes did not include any women mediators or women signatories. 
  • Economic Bias:
    • The recent increase in education achievements has not translated into better economic outcomes and opportunities for women.
    • Even in the 59 countries where adult women are more educated than men, the average income gap is 39 per cent.
    • This lack of progress in closing the gender gap in income is seen worldwide.
    • In countries with higher bias in gender social norms, women spend more time than men — nearly six times — on domestic chores and care work.
    • Gender-based inequalities in empowerment are partly because of biased gender social norms or the undervaluation of women’s capabilities and rights.

Way forward:

  • Even though the GSNI value changed little over the past decade, data has shown an increase in the share of people with no bias in any indicator, and this was evident in 27 of the 38 countries surveyed.
  • The past few decades have seen major breakthroughs in gender social norms influenced by policiesregulations and scientific breakthroughs.
    • One of the major examples is the birth control pill.
    • The birth control pill followed a volatile process until its eventual social acceptance, and this had a tremendous impact on women’s control over their bodies and ability to plan their families and professional lives.
  • Gender biases hold across regions, income levels and cultures.
  • Without tackling biased gender social norms, the world will not be able to achieve gender equality, as reflected in the UN-mandated Sustainable Development Goals.


NHAI’s first Sustainability Report

National Highway Authority of India’s (NHAI) First ‘Sustainability Report’ captures initiatives taken for Environment Sustainability

Key findings:

  • About the report:
    • NHAI’s first ‘Sustainability Report for FY 2021-22’ covers NHAI’s governance structurestakeholdersenvironment and social responsibility initiatives.
    • NHAI’s Sustainability Report is not a mandated requirement as per SEBI guidelines, but this has been taken as a voluntary initiative.
    • It is prepared as per the Global Reporting Initiative (GRI) reporting guidelines.
    • The report has been externally assured by a third party adhering to International Standards on Assurance Engagements.
  • Reduction in emissions:
    • From FY 2019-20 till 2021-22 direct emission reduced by 18.44% and 9.49% due to less fuel consumption.
    • NHAI continues to work towards reducing indirect emissions as well, by transiting towards clean and green energy sources.
    • Green House Gas (GHG) Emissions from energy consumption, operations, transport and travel saw a decline of 9.7% in FY 2020-21 and 2% in FY 2021-22.  
    • In operationsenergy intensity reduced by 37% in FY 2020-21 and 27% in FY 2021-22.
    • With over 97 percent penetration, Electronic Toll Collection through FASTag has contributed to reduce the carbon footprint.
  • Sustainable construction:
    • The kilometers constructed through the reporting period has risen steadily.
    • NHAI has been using recycled materials for National Highway construction.
    • Use of fly-ash and plastic waste in construction has increased over the last three years.
    • NHAI has  been encouraging use of Recycled Asphalt (RAP) and Recycled Aggregates (RA) in the National Highway construction.
  • Initiatives for environment:
    • In order to ensure sustainable environmental growth, more than 100 Wildlife Crossings were created as a measure for wildlife protection and conservation to reduce man-animal conflict.
    • NHAI has been undertaking plantation drives to develop eco-friendly National Highways.
    • There has been a significant increase in number of saplings.
    • Saplings were planted to offset direct emissions from the vehicles.
  • Work practices:
    • The report also highlights NHAI’s commitment to create inclusive and responsible work practices.
    • Over last three years, women employment and employment of marginalized communities at NHAI has increased.
    • With performance-based management system, NHAI has successfully promoted/encouraged women gender diversity and minority employees.

About NHAI:

  • The National Highways Authority of India is an autonomous agency of the Government of India.
  • It was set up in 1995.
  • It is responsible for management of the network of National Highways in India.
  • It is a nodal agency of the Ministry of Road Transport and Highways.


Global Slavery Index 2023

G20 countries including India are fuelling modern slavery, says new report.

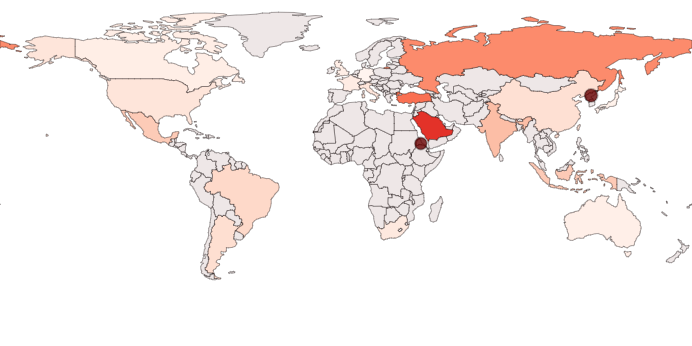
  • The Global Slavery Index 2023 shows the world’s 20 richest countries account for more than half the estimated 50 million people living in modern slavery.
  • The Group of 20 nations are contributing to this increase, as their trade operations and global supply chains allow for human rights abuses.
  • Among the G20 nations, India tops the list with 11 million people working as forced labourers, followed by China, Russia, Indonesia, Turkey and the U.S.

The Index

  • It is published by the Australia-based human Rights Group Walk Free Foundation.
  • It includes data on three key variables –
    1. Prevalence of modern slavery in each country
    2. Vulnerability
    3. Government responses to modern slavery
  • Modern slavery refers to situations of exploitation that a person cannot leave because of threats, violence, coercion and abuse of power or deception.
  • The index uses data released by the International Labour Organisation (ILO), Walk Free, and the International Organisation for Migration (IOM).

Global Slavery Index, 2023