


All India Survey of Higher Education (AISHE) 2021–22 was made public on January 25, 2024.
- Initiated in – 2011.
- Aim – To give complete picture of Higher Education in the country.
- 3 Categories – Universities, Colleges and Stand-alone institutions.
- Data source – Voluntary uploading of data by institutions of Higher Education listed in www.aishe.gov.in portal.
- AISHE 2021-22 – It was the 11th Survey and 1st Survey conducted through Web Data Capture Format (DCF).
For the 1st time, all the major Stakeholders in Higher Education, such as UGC, AICTE, MCI as well as State Governments participated in the data collection exercise for AISHE 2021-22.
Key takeaways from AISHE 2021-22 Report
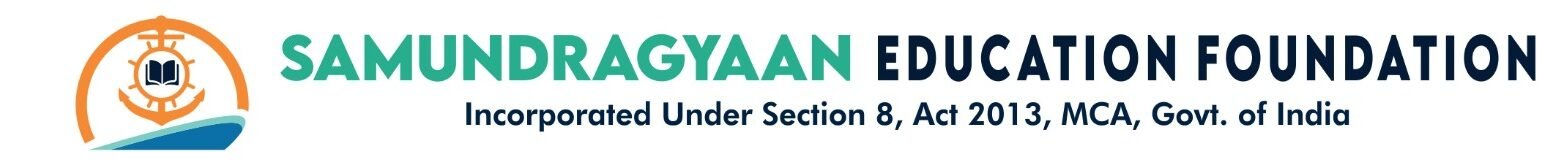
- Increase in enrolment – 4.33 crore students, up from 2020-21 level, captured in 8 different levels.
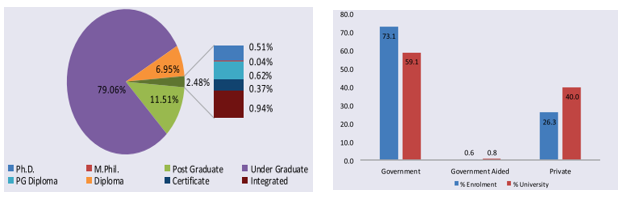
- Primacy of government institutions – 73.7% of all students attend government universities, where state public universities have the largest share of enrolment, accounting for around 31%.
- Higher enrolment of females – It has steadily increased to 2.07 crores in 2021-22, a 32% jump from 2014-15 levels with the highest numbers at the post graduate level, 55.4% are women.
- Gender Enrolment Ratio – It is 28.4 for the age group 18-23 years at all India level (population data from the 2011 census) and is in favour of women in 26 states and Union Territories.
- Chandigarh boasts of the highest GER (64.8%), followed by Puducherry, Delhi and Tamil Nadu.
Gross Enrolment Ratio (GER) indicates how many students are part of the higher education system in a given population.
- Gender Parity Index – It is 1.01 at all-India level, and for SC and ST categories, it is 1.01 and 0.98 respectively.
Gender Parity Index (GPI) shows the ratio of the female GER to male GER. A GPI of 1 indicates parity between the two genders, GPI greater than 1 indicates a disparity in favour of females.
- Higher preferences for Arts – In UG, Bachelor of Arts (BA) and in PG, Master of Arts (MA) programme has the highest enrolment.
- Demographics of students graduating – Among the graduated students, roughly 50.8% are women and the graduation rate in arts and social sciences streams is higher than others.
- Category-wise, around 35% of the students belong to OBC, 13% are from SC and 5.7% are from ST community.